On the Probability of a TSLA Stock Crash
Timothy Klassen had an interesting post on linkedin recently, with the title “the options market thinks there is a 16% chance that Tesla will not exist in January 2020”. As I was also recently looking at the TSLA options, I was a bit intrigued. I looked at the option chain on July 10th, and implied the European volatility from the American option prices. I then fit a few of my favorite models: Andreasen-Huge with Tikhonov regularization, the lognormal mixture, and a polynomial collocation of degree 7. This results in the following graph
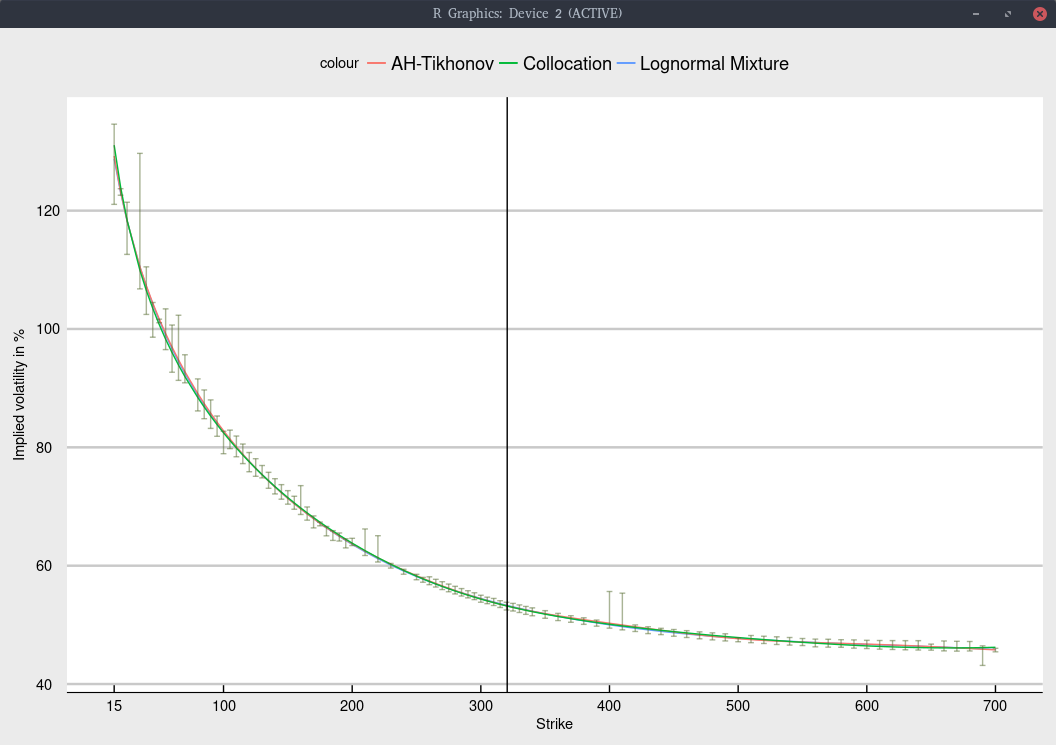
Black volatility implied from Jan 2020 TSLA options.
The shape is not too difficult to fit, and all models give nearly the same fit, within the bid-ask spread as long as we include an inverse relative bid-ask spread weighting in the calibration. Note that I removed the quote for strike 30, as the bid-ask spread was, unusually extremely large and would only introduce noise.
Like Timothy Klassen, we can look at the implied cumulative density of each model.
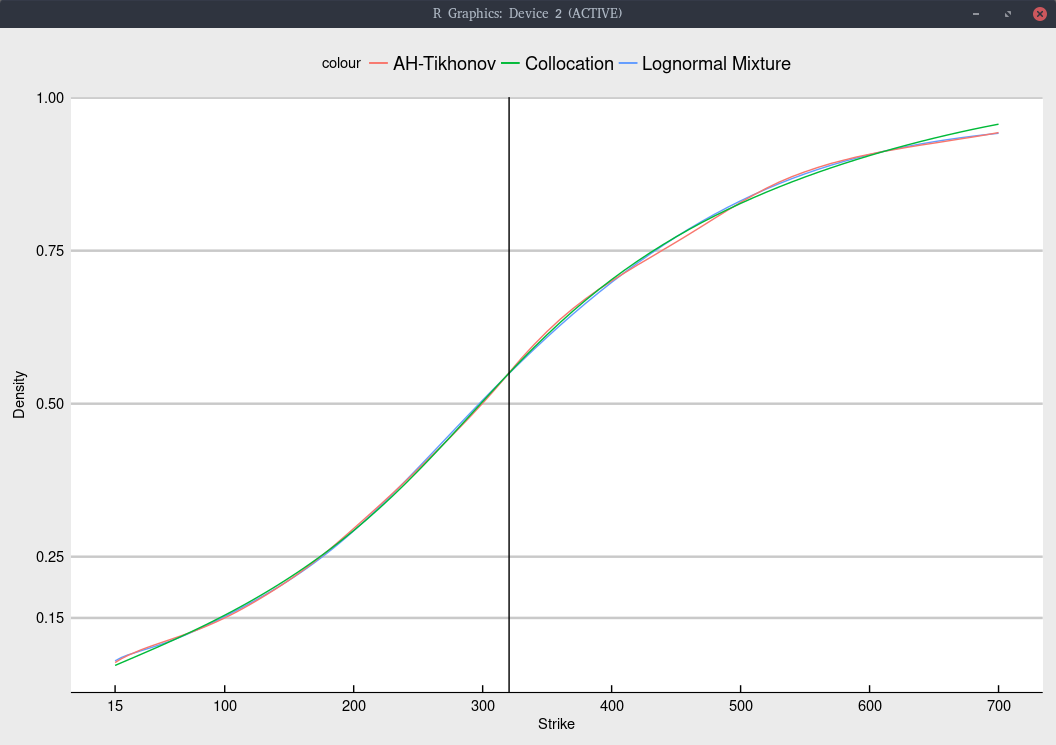
Cumulative density implied from Jan 2020 TSLA options.
More explicitely, we obtain
| Model | probability of TSLA < 100 | probability of TSLA < 15 |
|---|---|---|
| Collocation | 15.4% | 7.2% |
| Lognormal Mixture | 15.2% | 8.0% |
| Andreasen-Huge regularized | 15.0% | 7.7% |
It would have been great of Timothy Klassen had shown the implied density as well, in the spirit of my earlier posts on a similar subject.
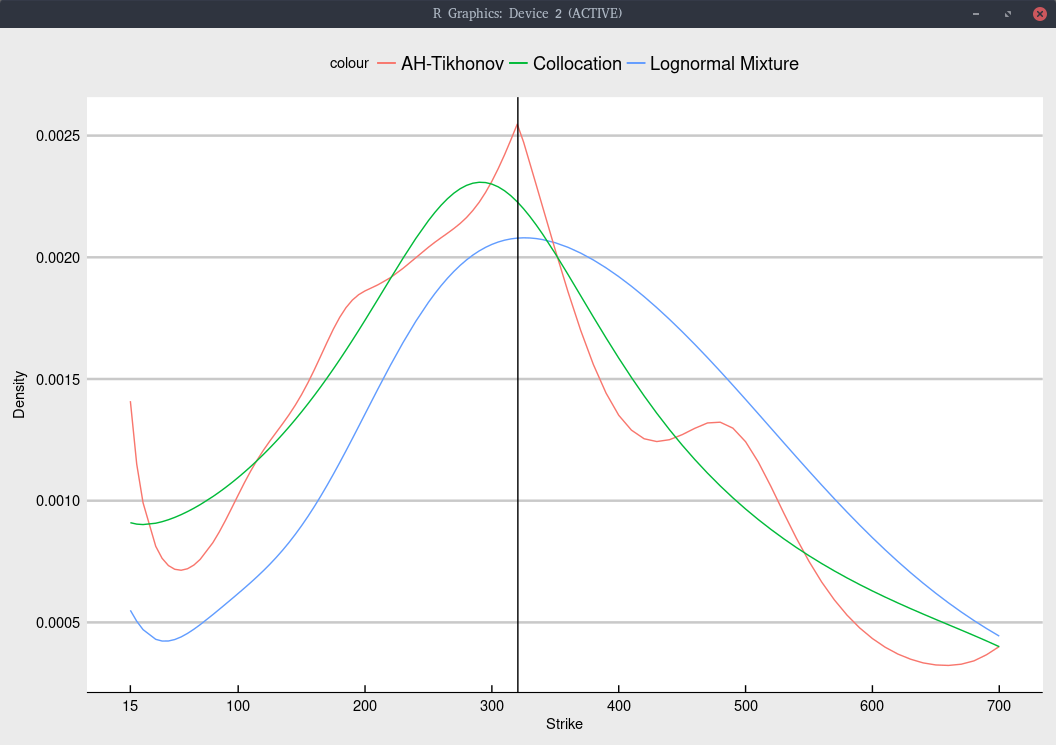
Probability density implied from Jan 2020 TSLA options.
In particular, the choice of model has a much stronger impact on the implied density. Even though Andreasen-Huge has more modes, its fit in terms of volatilities is not better than the lognormal mixture model. We could reduce the number of modes by increasing the constant of the Tikhonov regularization, at the cost of a slightly worse fit.
The collocation produces a significantly simpler shape. This is not necessarily a drawback, since the fit is quite good and more importantly, it does not have a tendency to overfit (unlike the two other models considered).
| Model | weighted root mean square error in vols |
|---|---|
| Collocation | 0.00484 |
| Lognormal Mixture | 0.00432 |
| Andreasen-Huge regularized | 0.00435 |
The most interesting from T. Klassen plot, is the comparison with the stock price across time. It is expected that the probability of going under $100 will be larger when the stock price moves down, which is what happen around March 27, 2018. But it is not so expected that when it comes back up higher (above $350 in mid June), the probability of going under $100 stays higher than it was before March 27, 2018, where the stock price was actually lower. In fact, there seems to be a signal in his time-serie, where the probability of going under $100 increases significantly, one week before March 27, that is one week before the actual drop, suggesting that the drop was priced in the options.