When SVI Breaks Down
In order to fit the implied volatility smile of equity options, one of the most popular parameterization is Jim Gatheral’s SVI, which I have written about before here.
It turns out that in the current market conditions, SVI does not work well for short maturities. SPX options expiring on March 24, 2017 (one week) offer a good example. I paid attention to include only options with non zero volume, that is options that are actually traded.
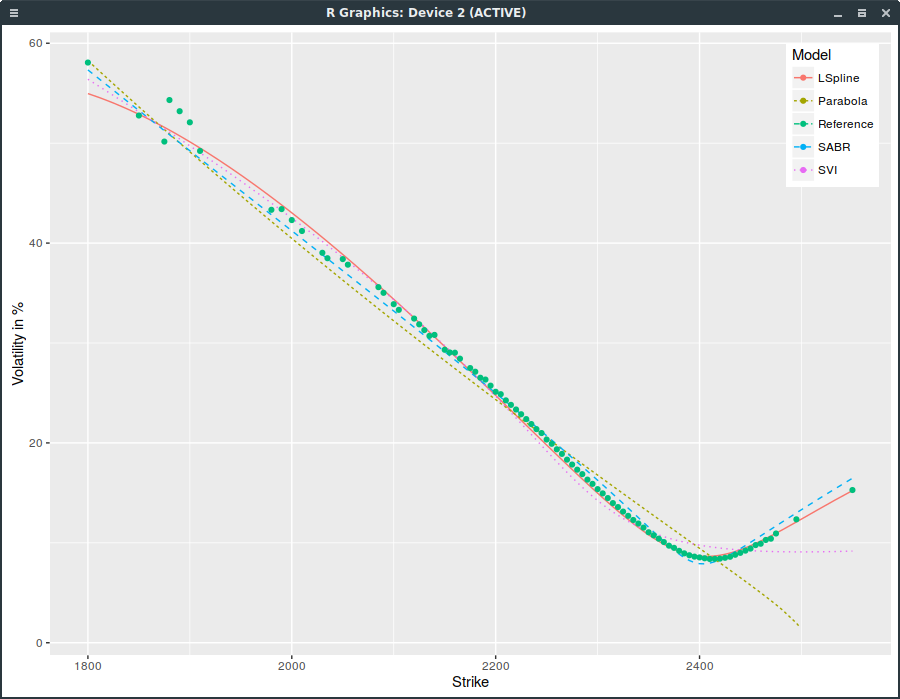
SPXW implied volatilities on March 16, 2017 with strictly positive volume.
SVI does not fit well near the money (the SPX index is at 2385) and has an obviously wrong right wing. This is not due to the choice of weights used for the calibration (I used the volume as weight; equal weights would be even worse). Interestingly, SABR (with beta=1) does much better, even though it has two less parameters than SVI. Also a simple least squares parabola here does not work at all as it ends up fitting only the left wing.
If we include all options with non zero open interest and use ask/(bid-ask) weights, SVI is even worse:
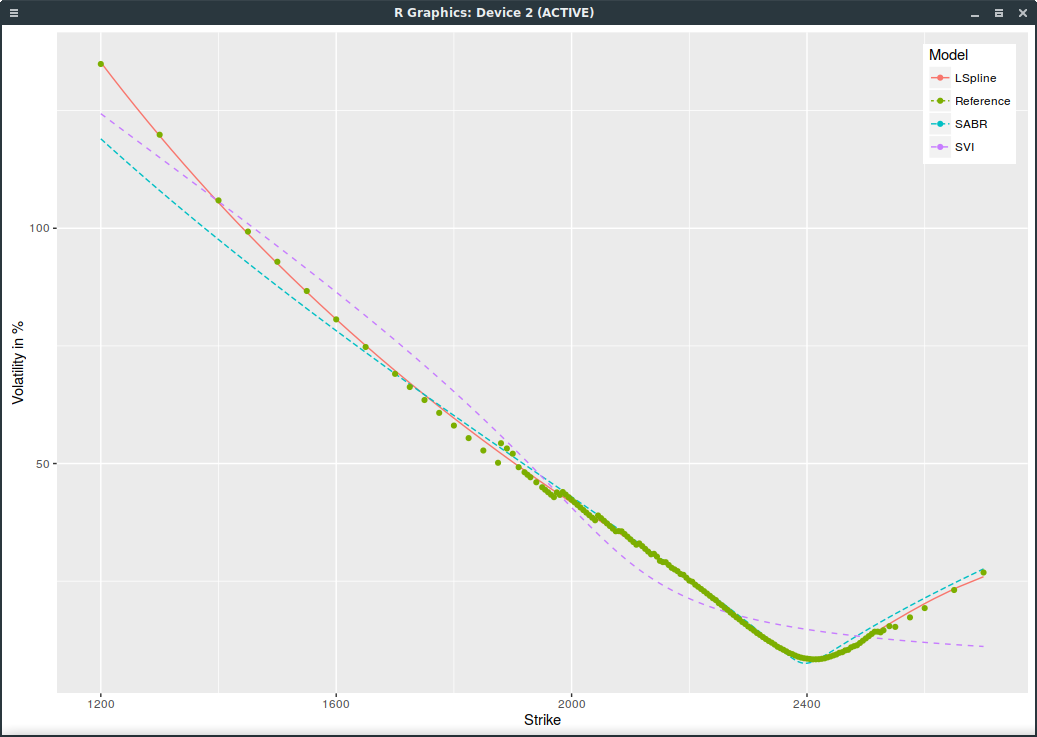
SPXW implied volatilities on March 16, 2017 with strictly positive open interest.
We can do a bit better with SVI by squaring the weights and it shows the problem of SVI more clearly:
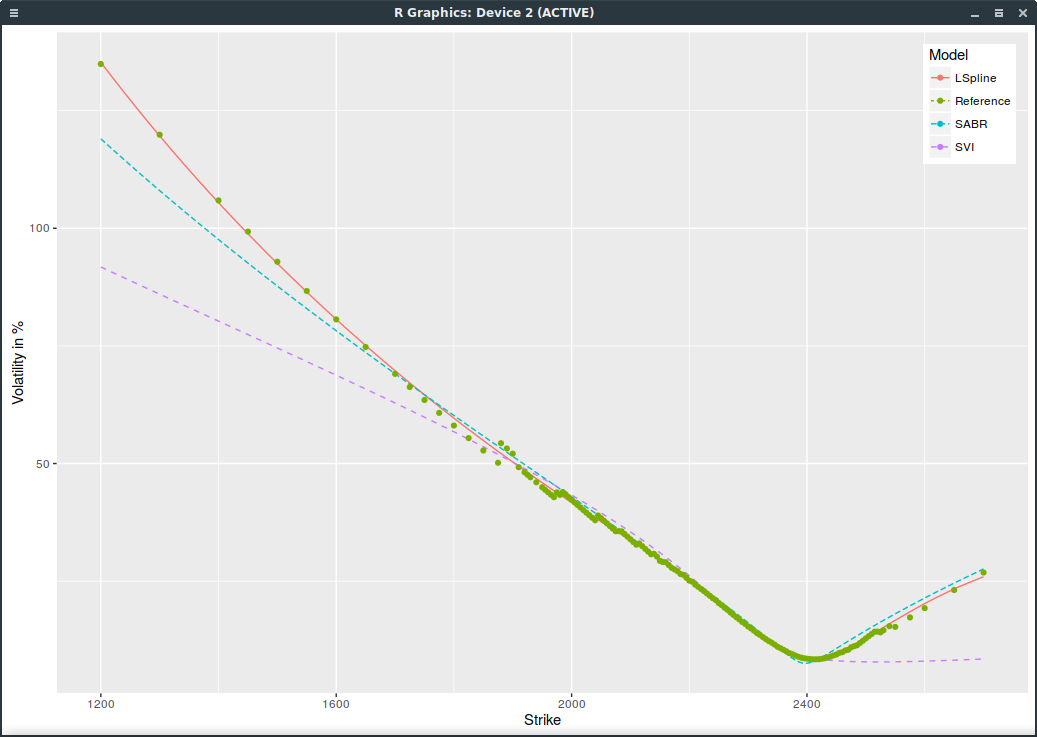
SPXW implied volatilities on March 16, 2017 with strictly positive open interest and SVI weights squared.
These days, the VIX index is particularly low. Today, it is at 11.32. Usually, a low VIX translates to growing stocks as investors are confident in a low volatility environment. The catch with those extremely low ATM vols, is that the curvature is more pronounced, and so people are not so confident after all.