The Return of the Arbitrage in the Perfect Volatility Surface
In a Wilmott article from 2018 (Wilmott magazine no. 97) titled “Arbitrage in the perfect volatility surface”, Uwe Wystup points out some interesting issues on seemingly innocuous FX volatility surfaces:
- a cubic spline tends to produce artificial peaks/modes in the density.
- SVI not arbitrage-free even on seemingly trivial input.
The examples provided are indeed great and the remarks very valid. There is more to it however:
- a cubic spline on strikes or log-moneyness does not produce the artificial peak.
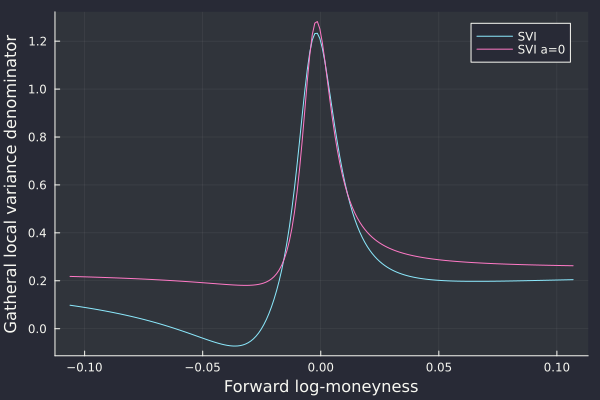
- SVI with a=0 is arbitrage-free on this example.
For the first point, the denominator of the Dupire formula in terms of the representation of total variance as a function of logmoneyness gives some clues as it constitues a vega scaled version of the probability density
with direct link to the total variance and its derivatives. In particular it is a simple function of its value, first and second derivatives, without involving any non-linear function and the second derivative only appears as a linear term. As such a low order polynomial representation of the variance in log-moneyness may be adequate.
In contrast, the delta based representation introduces a strong non-linearity with the cumulative normal distribution function.
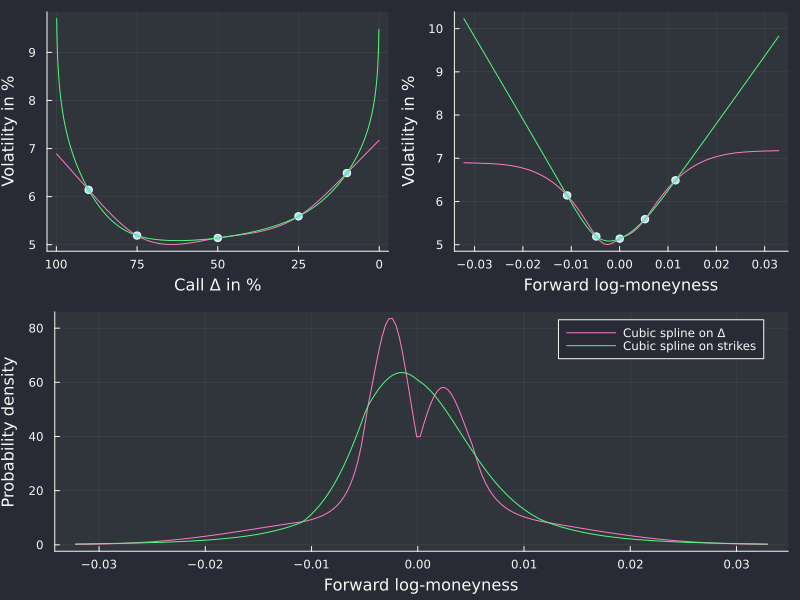
Splines on AUD/NZD 1w options.
For the second point, it is more of a curiosity. Everybody knows that SVI is not always arbitrage-free and examples of arbitrages abound. Finding such a minimal example is
nice. I noticed that many of the real life butterfly spread arbitrages are avoided if we follow Zeliade’s recommendation to set a >= 0, where a is the base ordinate parameter of SVI.
Yes the fit is slightly worse, but the increased calibration robustness and decrease of the number of smiles with arbitrage is probably worth it.
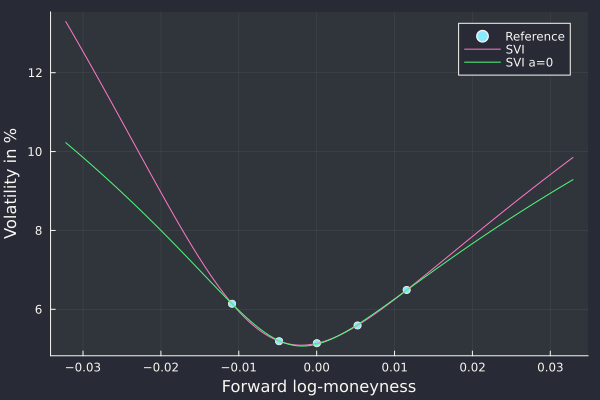
SVI on AUD/NZD 1w options.
SVI on AUD/NZD 1w options.
Even if I am no particular fan of SVI or of the cubic spline to represent implied volatilities, the subject merited some clarifications.
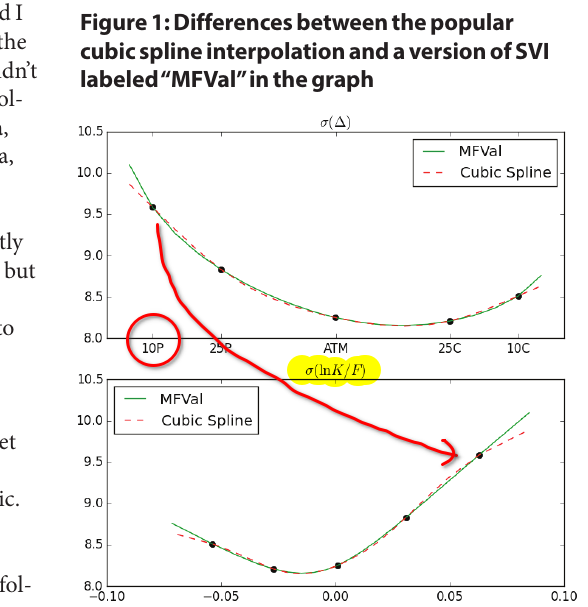
extract of the Wilmott article.

Ooohhhh!
It is reassuring that this kind of mistakes also happen to the best. Every FX quant has Uwe Wystup’s book, next to the Clark and the Castagna.