The Mystic Parabola
I recently had some fun trying to work directly with the option chain from the Nasdaq website. The data there is quite noisy, but a simple parabola can still give an amazing fit. I will consider the options of maturity two years as illustration. I also relied on a simple implied volatility algorithm that can be summarized in the following steps:
- Compute a rough guess for the forward price by using interest, borrow curves and by extrapolating the dividends.
- Imply the forward from the European Put-Call parity relationship on the mid prices of the two strikes closes to the rough forward guess. A simple linear interpolation between the two strikes can be used to compute the forward.
- Compute the Black implied volatilities as if the option were European using P. Jaeckel algorithm.
- Calibrate the proportional dividend amount or the growth rate by minimizing, for example with a Levenberg-Marquardt minimizer, the difference between model and mid-option prices corresponding to the three strikes closest to the forward. The parameters in this case are effectively the dividend amount and the volatilities for Put and Call options (the same volatility is used for both options). The initial guess stems directly from the two previous steps. American option prices are computed by the finite difference method.
- Solve numerically the volatilities one by one with the TOMS748 algorithm so that the model prices match the market mid out-of-the-money option prices.
Then I just fit a least squares parabola in variance on log-moneyness, using options trading volumes as weights and obtain the following figure:
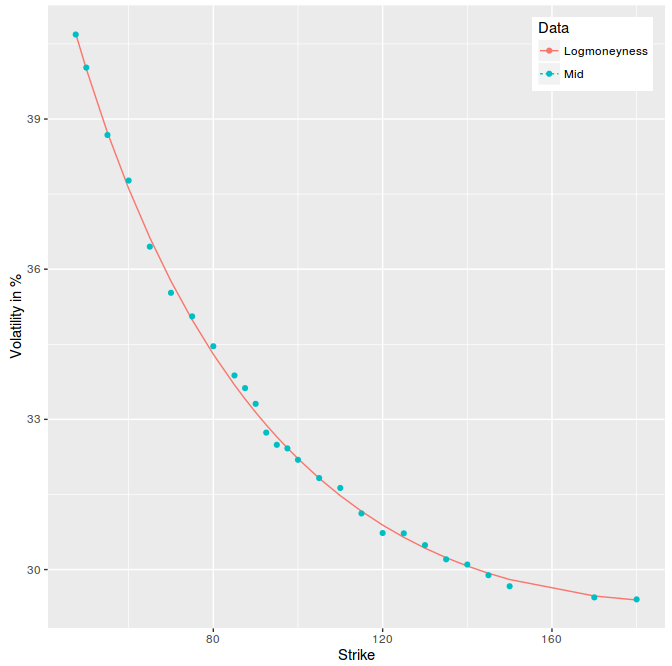
least squares parabola on 2y AAPL options.
Isn’t the fit just amazing? Even if I found it surprising, it’s probably not so surprising. The curve has to be smooth, somewhat monotone, and will be therefore like a parabola near the money. While there is no guarantee it will fit that well far away, it’s actually a matter of scale. Short maturities will lead to not so great fit in the wings, while long maturities will correspond to a narrower range of scaled strikes and match better a parabola.