March 9, 2020 crash - where will CAC40 go?
The stock market crashed by more than 7% on March 9, 2020. It is one of the most important drop since September 2001. I looked at BNP warrant prices on the CAC40 French index, with a maturity of March 20, 2020 , to see what they would tell about the market direction on the day of the crash. This is really a not-so-scientific experiment.
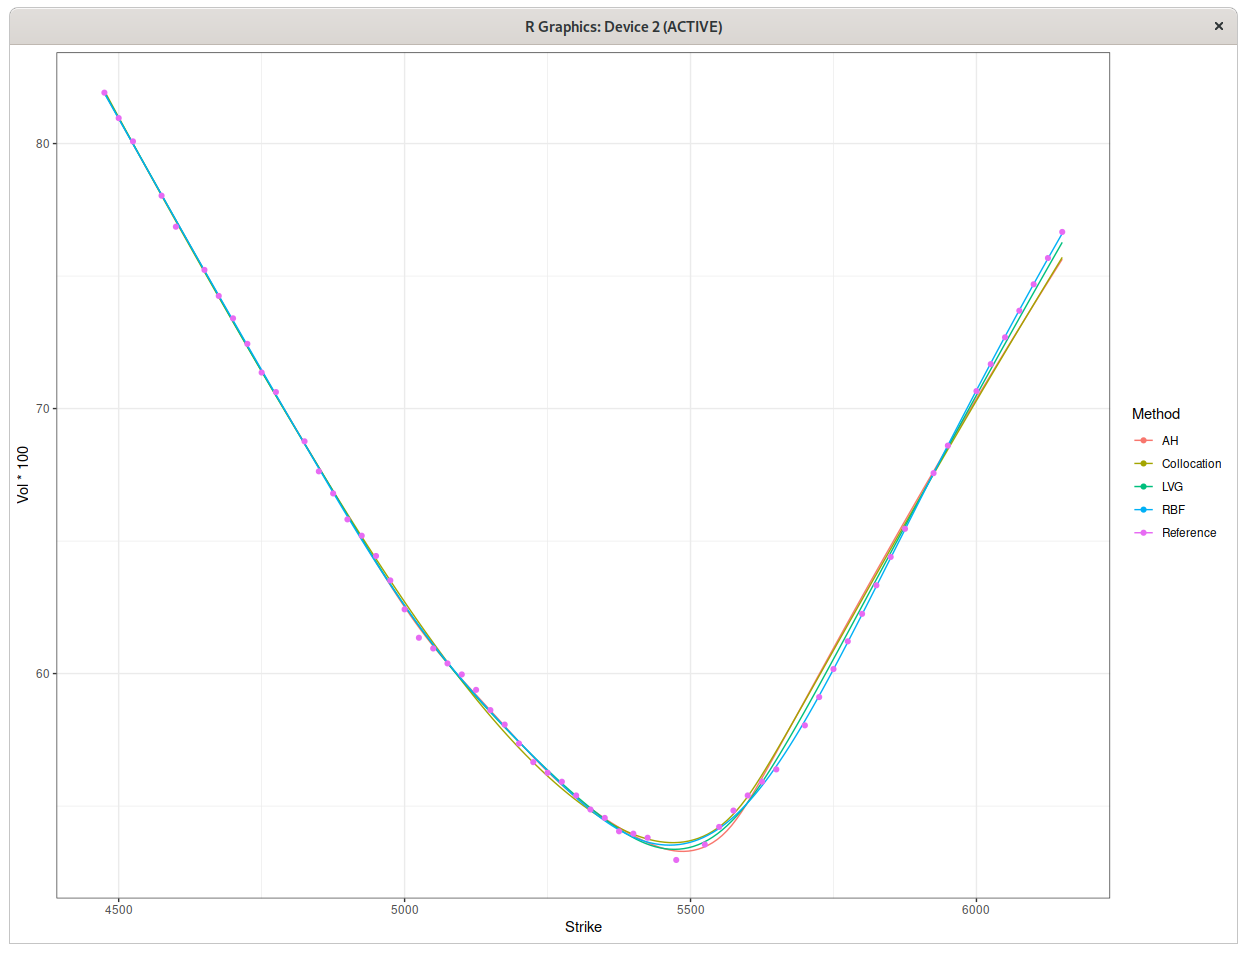
The quotes I got were quite noisy. I applied a few different techniques to imply the probability density from the option prices:
- The one-step Andreasen-Huge with some regularization. The regularization is a bit too mild, although, in terms of implied vol, this was the worst fit among the techniques.
- The stochastic collocation towards a septic polynomial, no regularization needed here. The error in implied volatilities is similar to Andreasen-Huge, even though the implied density is much smoother. I however discovered a small issue with the default optimal monotonic fit, and had to tweak a little bit the optimal polynomial, more on this later in this post.
- Some RBF collocation of the implied vols. Best fit, with regularization, and very smooth density, which however becomes negative in the high strikes.
- Some experimental Andreasen-Huge like technique, with a minimal grid and good regularization.
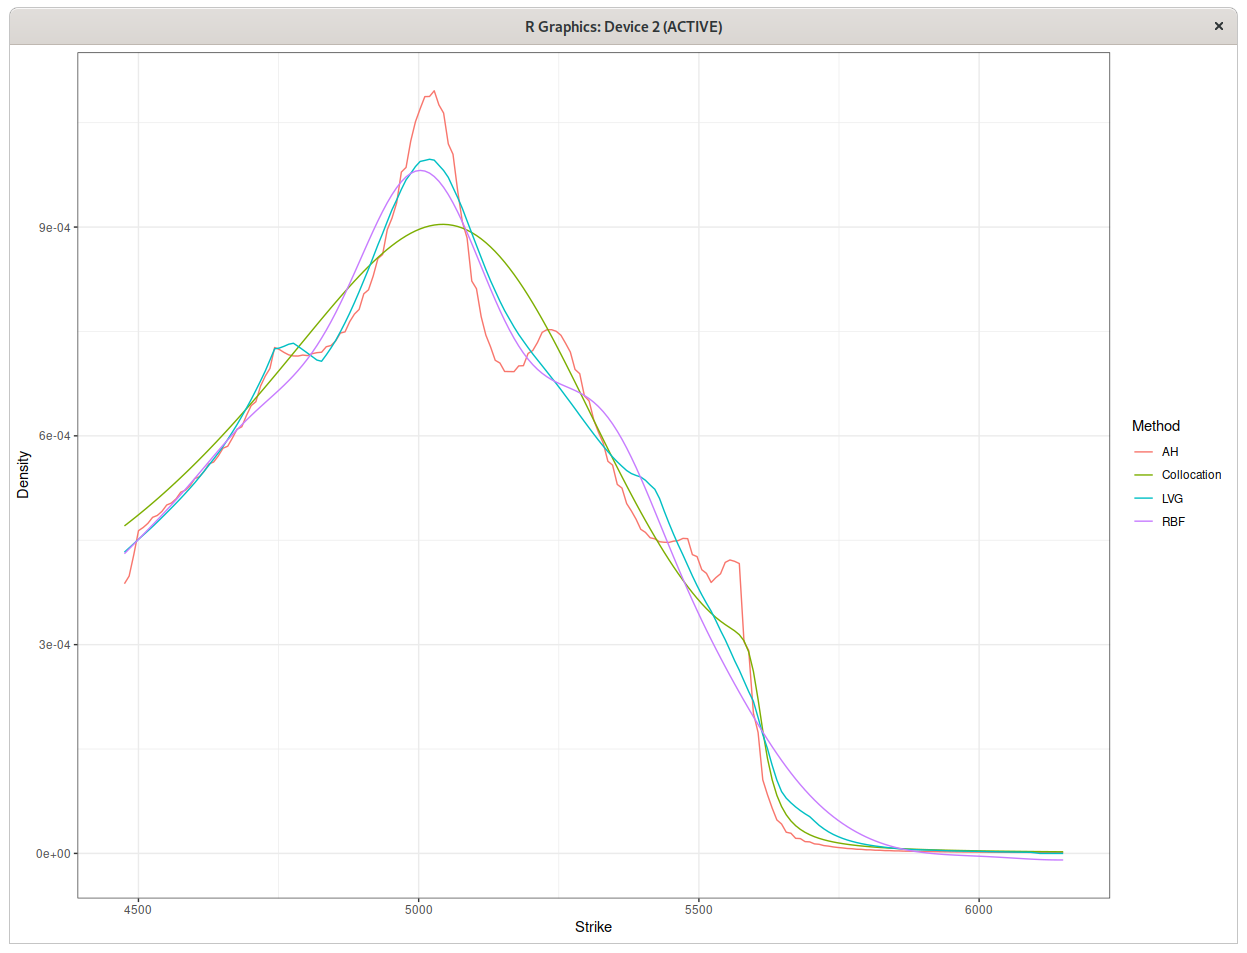
Implied probability density for March 20, CAC40 warrants.
The implied forward price was around 4745.5. Interestingly, this corresponds to the first small peak visible on the blue and red plots. The strongest peak is located a little beyond 5000, which could mean that the market believes that the index will go back up above 5000. This does not mean that you should buy however, as there are other, more complex explanations. For example, the peak could be a latent phenomenon related to the previous days.
Now here is how the plot is with the “raw” optimal collocation polynomial:
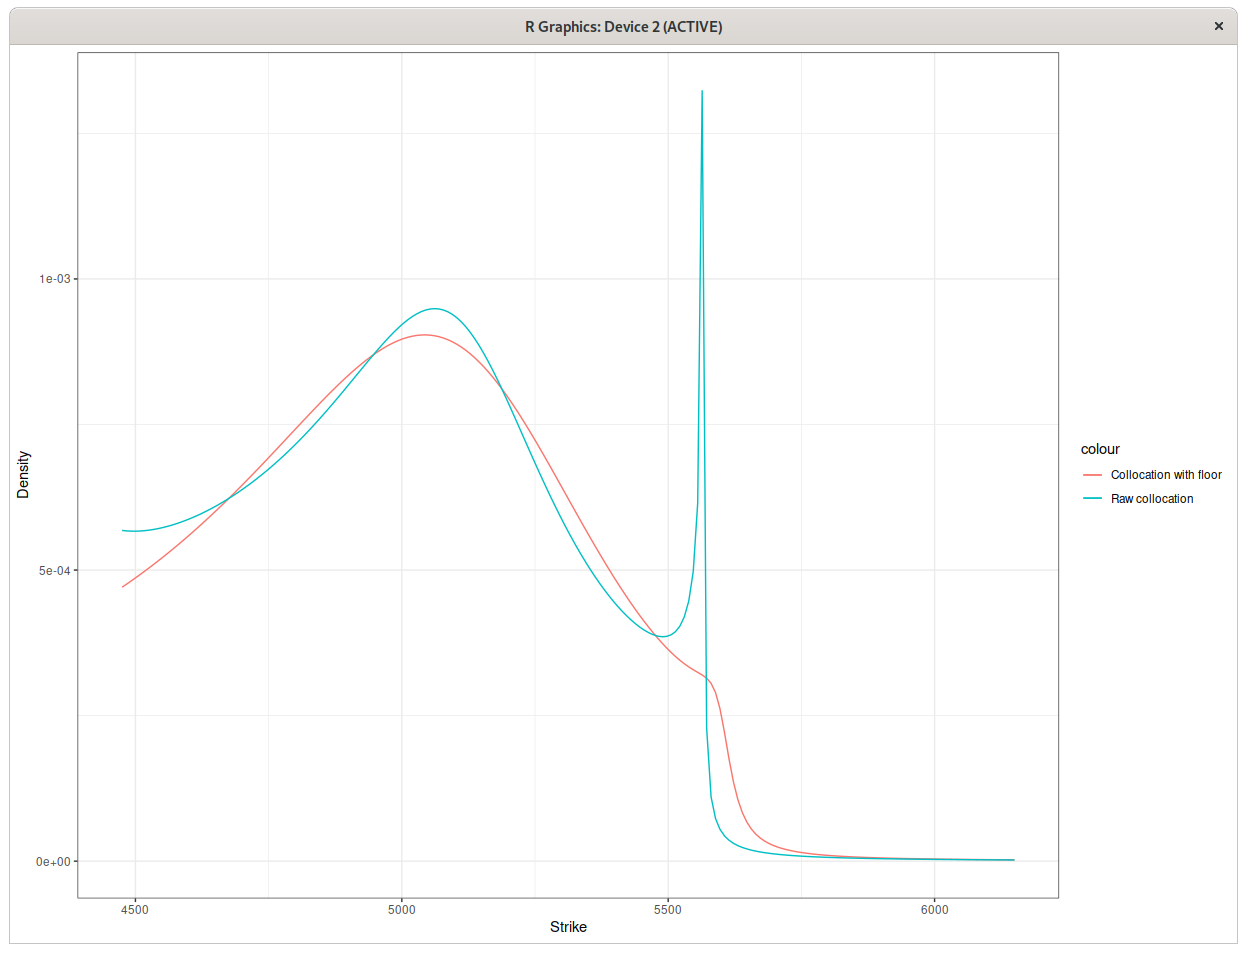
Implied probability density for March 20, CAC40 warrants with raw optimal polynomial collocation.
Notice the spurious peak. In terms of implied volatility, this corresponds to a strange, unnatural angle in the smile. The reason for this unnatural peak lies in the details of the stochastic collocation technique: the polynomial we fit is monotonic, but ends up with slope close to zero at some point in order to better fit the data. If the slope is exactly zero, there is a discontinuity in the density. Here the very low slope tranlates to the peak. The fix is simply to impose a floor on the slope (although it may not be obvious in advance to know how much this floor should be).
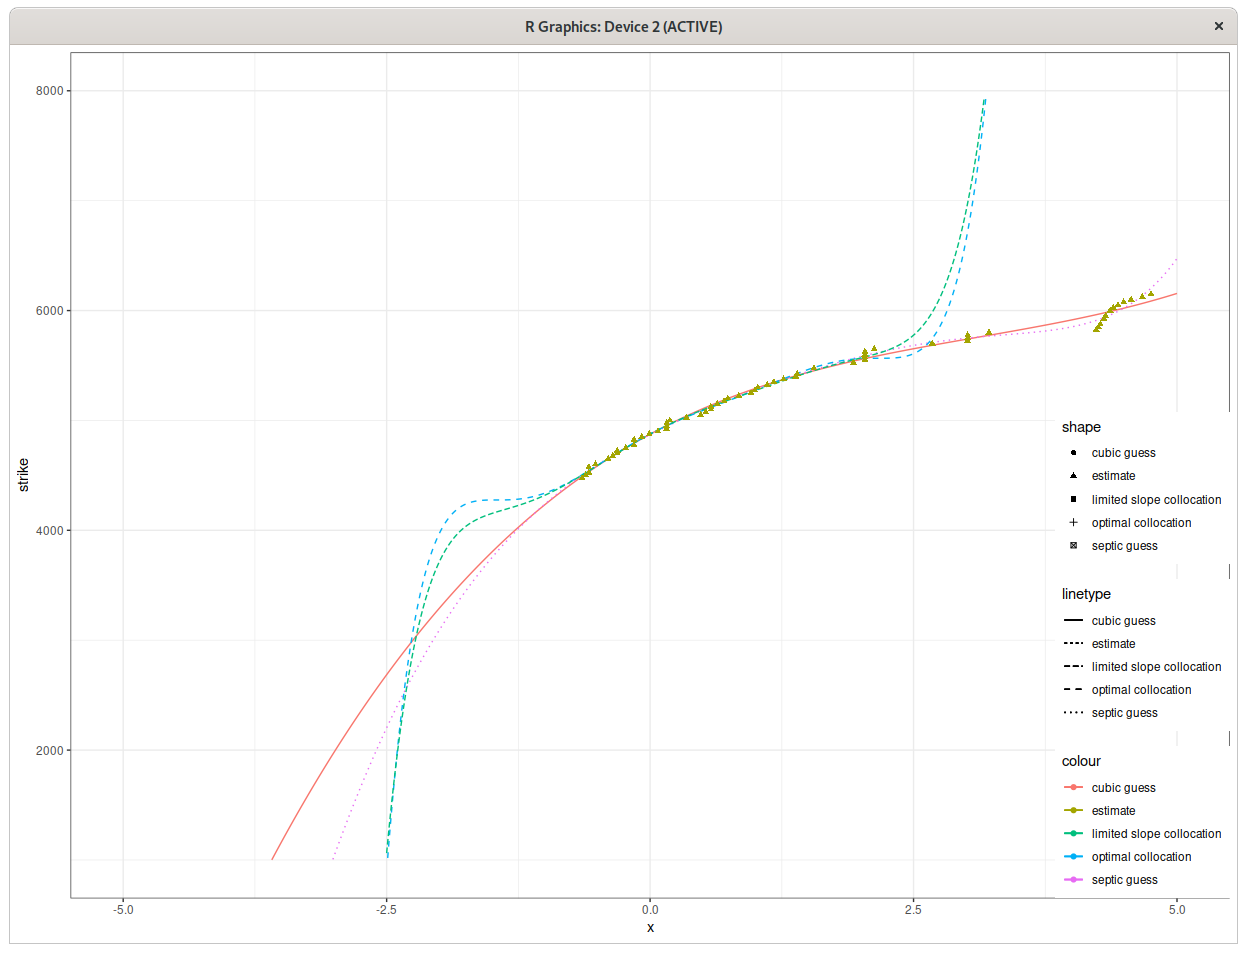
Collocation polynomials for March 20, CAC40 warrants.
And for the curious, here are the implied vol plots: