Roughness of the Implied Volatility
This is a follow up of my previous post on rough volatility. I recently tried to reproduce the results of the paper Rough Volatility: Fact or Artefact? as I was curious to apply the technique using different inputs. The 5-minutes SPX realized volatility is freely available in CSV format at the Oxford-Man Institute of Quantitative Finance and it is thus relatively straightforward to reproduce the numbers presented in the paper.
Using a sampling of K=75 and L=75*75, I obtain an rounghness index H=0.181. The paper uses K=70 and L = 70x70, and their Figure 19 of the paper states 0.187.
It turns out that there are more than L observations in the time-series, and, with K=70, I end up with a roughness index H=0.222 when I start from the first observation (year 2000), up to the observation L+1. But it is possible to slide this window and compute the roughness index at each starting point. The results are enlightening.
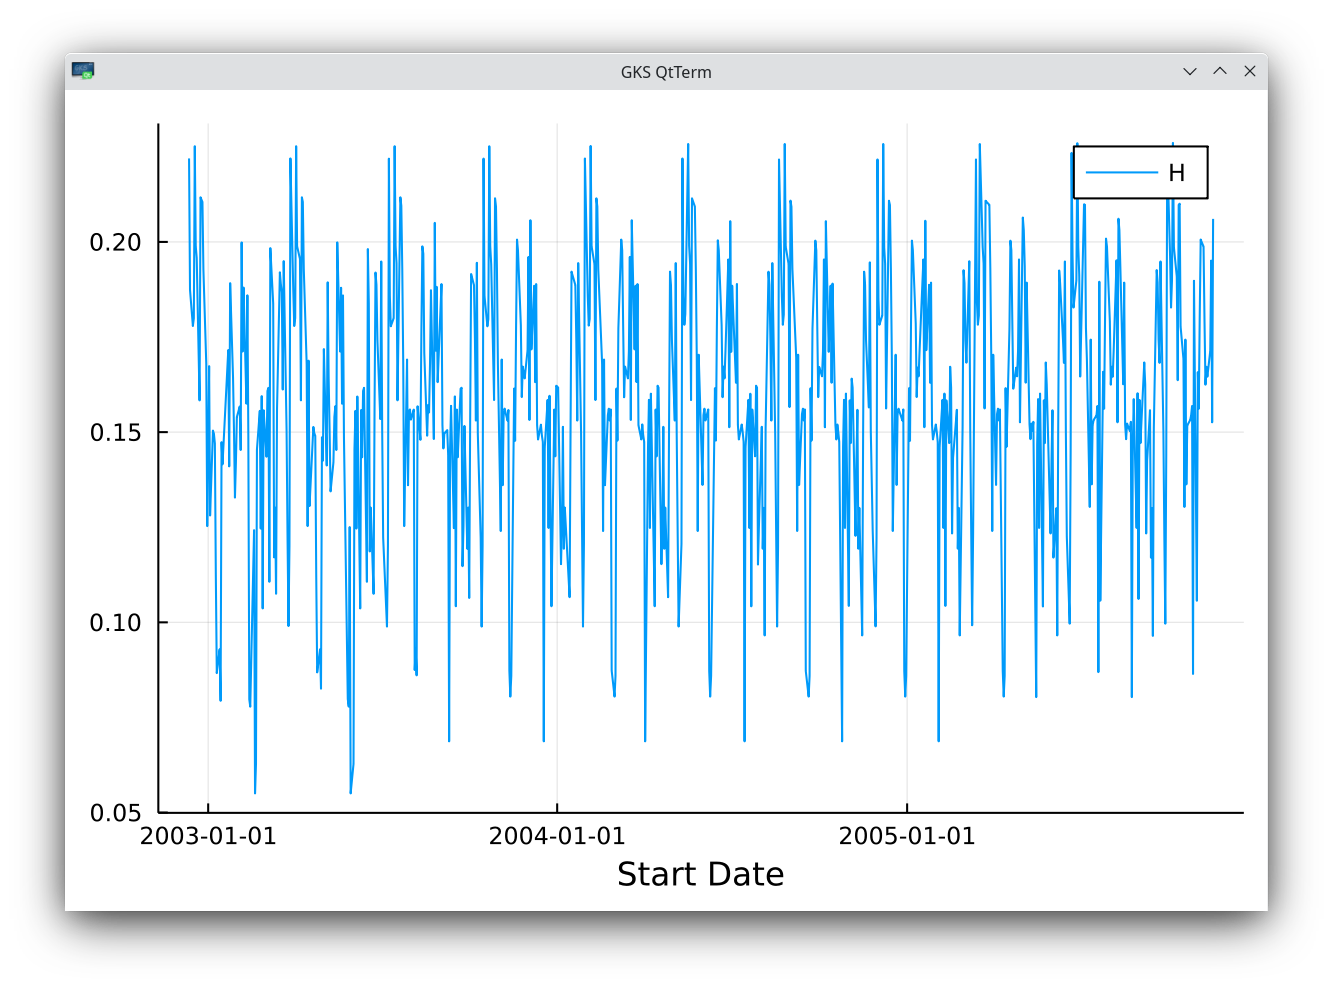
SPX historical vol roughness index sliding estimate with K=70.
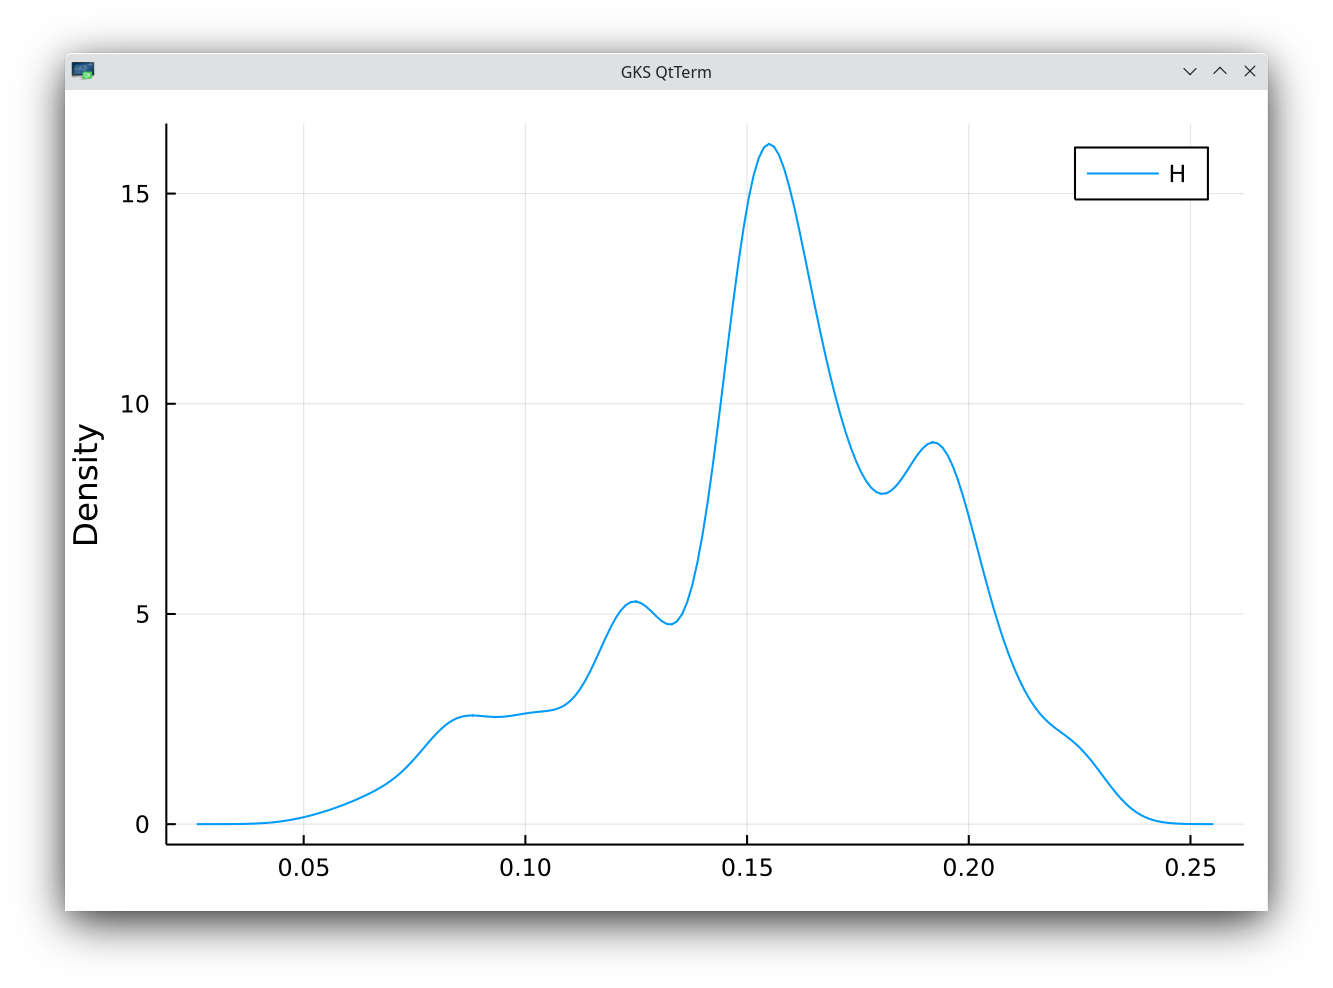
density of SPX historical vol roughness index estimate with K=70. The mean is 0.158 with a standard deviation of 0.034
The mean estimated roughness is 0.158 with a standard deviation of 0.034. The results of the paper are within one standard deviation. But it shows it may be dangerous to use a single window for the estimate. If we use a smaller window size K=50, L=50x50, we can see regimes of roughness in time.
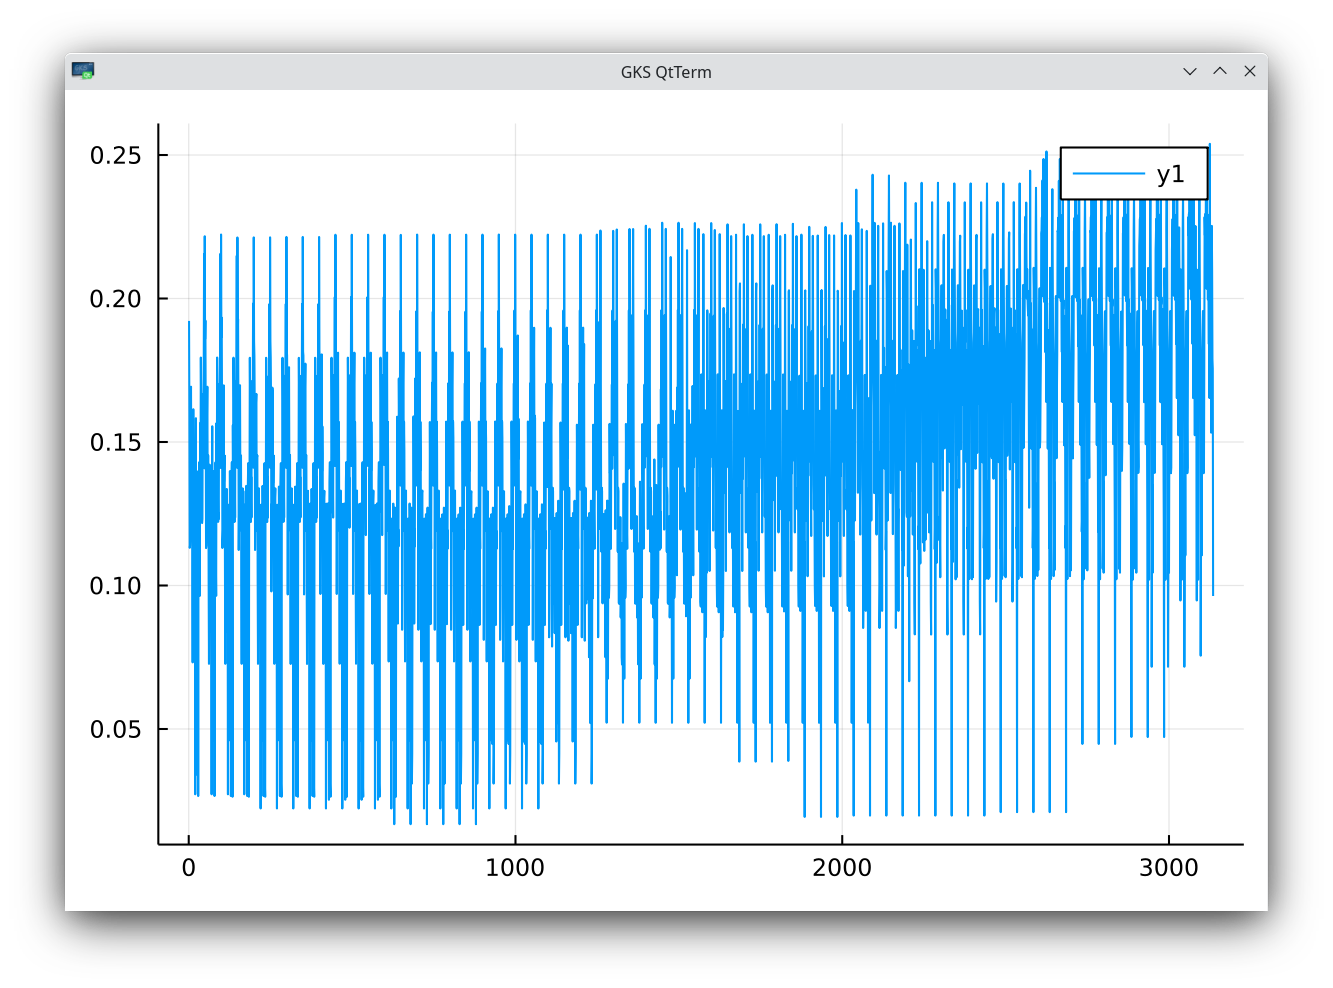
SPX roughness index sliding estimate with K=50.
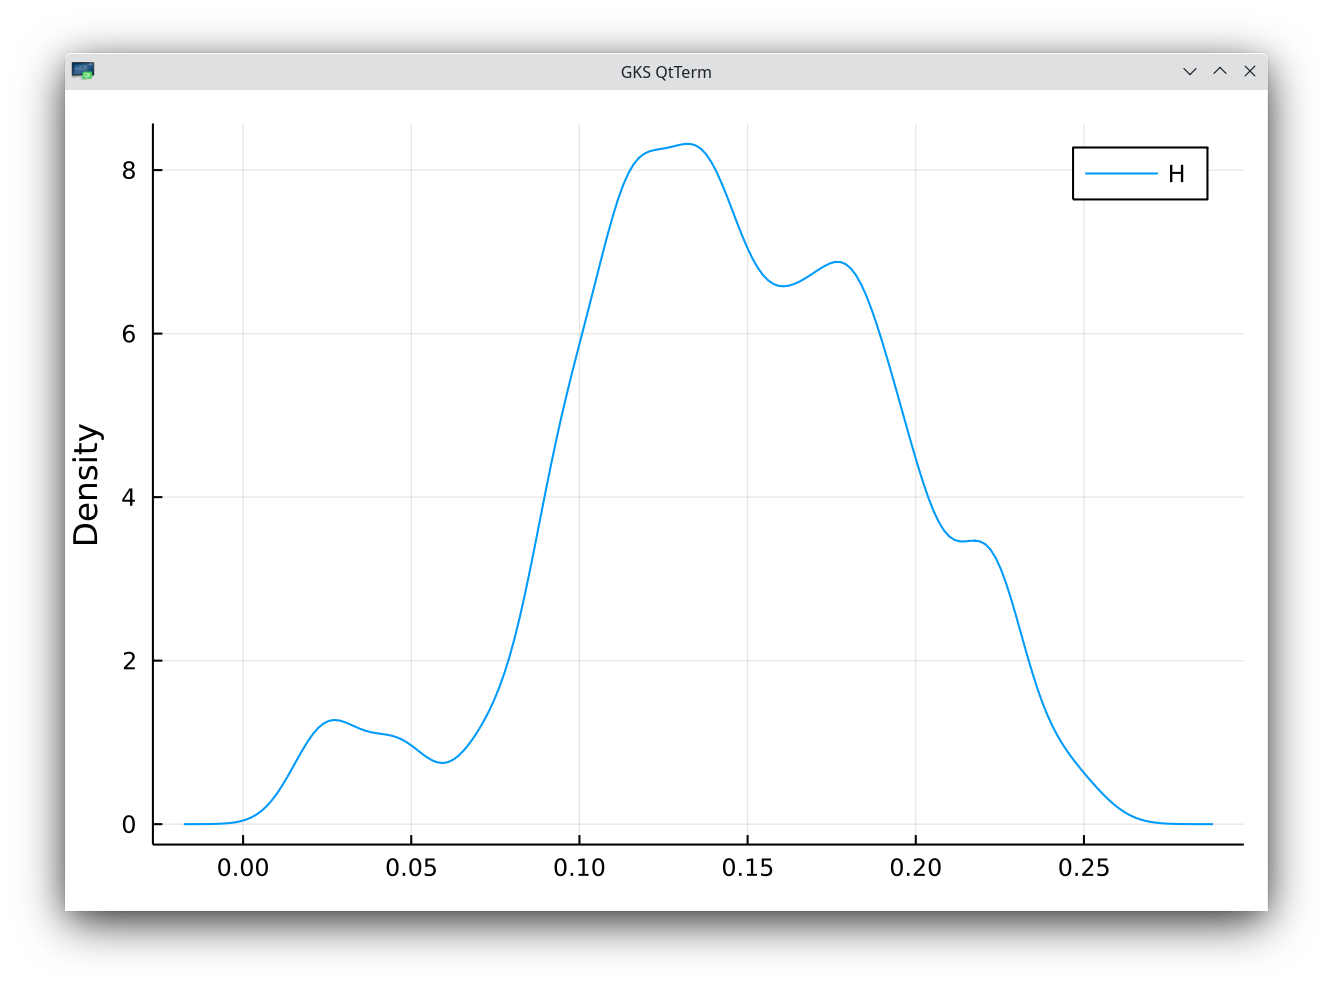
density of SPX roughness index estimate with K=70. The mean is 0.145 with a standard deviation of 0.048
I also double checked that the SPX closing prices resulted in an estimate H=0.5, for the two window sizes. The SPX price process follows the standard Brownian motion statistics.
The paper explains that using the 5 minutes realized volatility is not necessarily a good proxy to measure the true underlying instant volatility roughness. I wondered then what happened if we use the daily quotes of the short term at-the-money (ATM) implied volatility as a proxy. Indeed, in a given stochastic volatility model, the short term ATM implied volatility is approximately the instant volatility of the stochastic volatility process. It turns out that there is some freely available data from the Nasdaq for MSFT, but only for the period 2015-01-02 to 2018-12-32 (four years). This constitutes 1006 samples. For the 30-day implied volatility, with K=28, the data implies a roughness index close to 0.5 (0.448).
density of MSFT 30-day implied volatility roughness index estimate. The mean is 0.448 with a standard deviation of 0.059
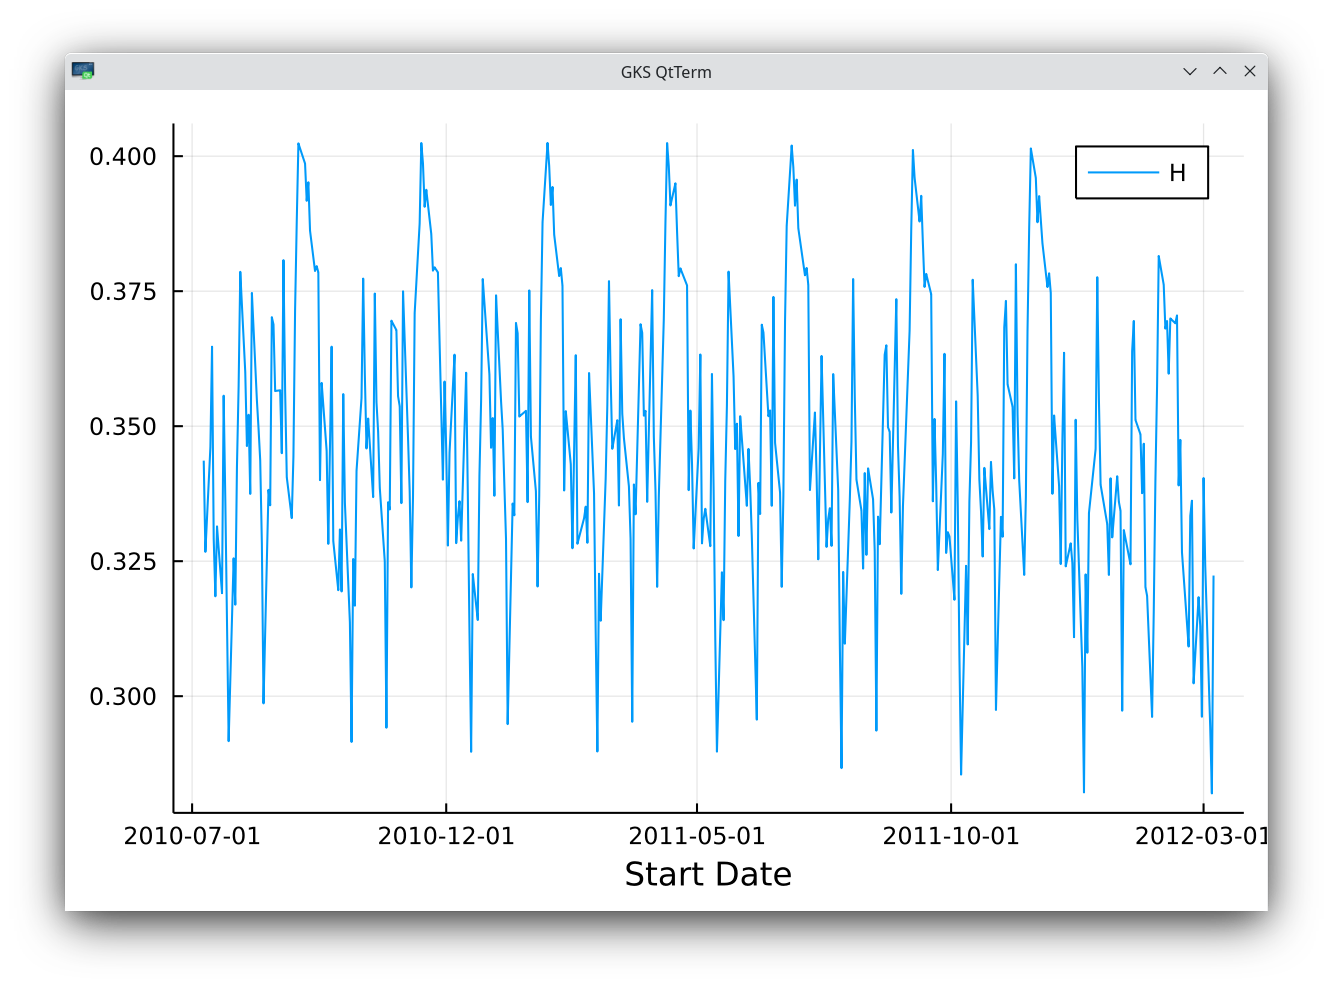
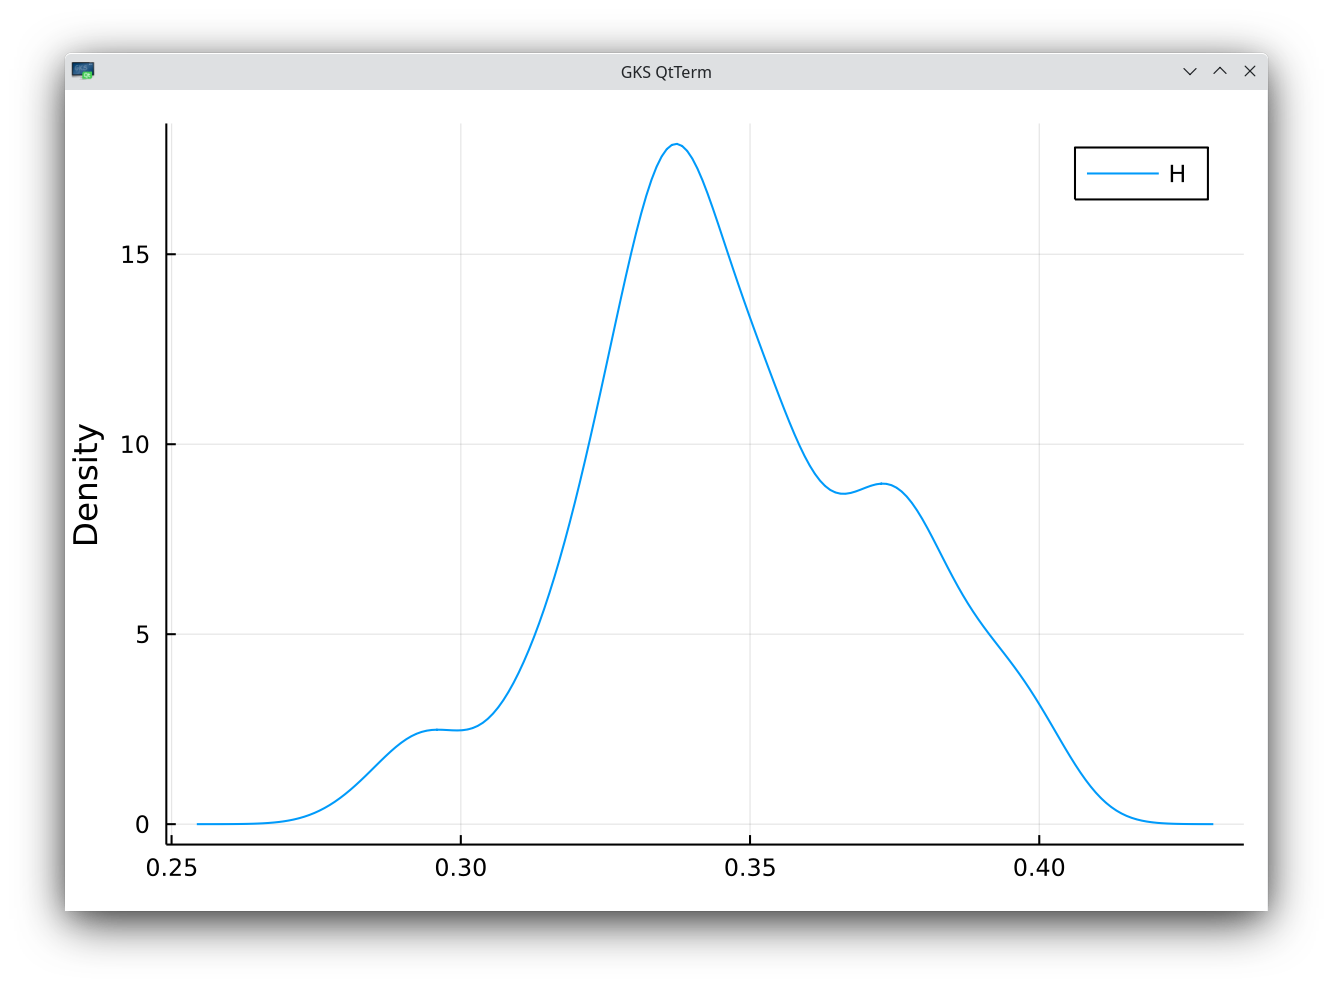
density of MSFT 10-day implied volatility roughness index estimate. The mean is 0.350 with a standard deviation of 0.049
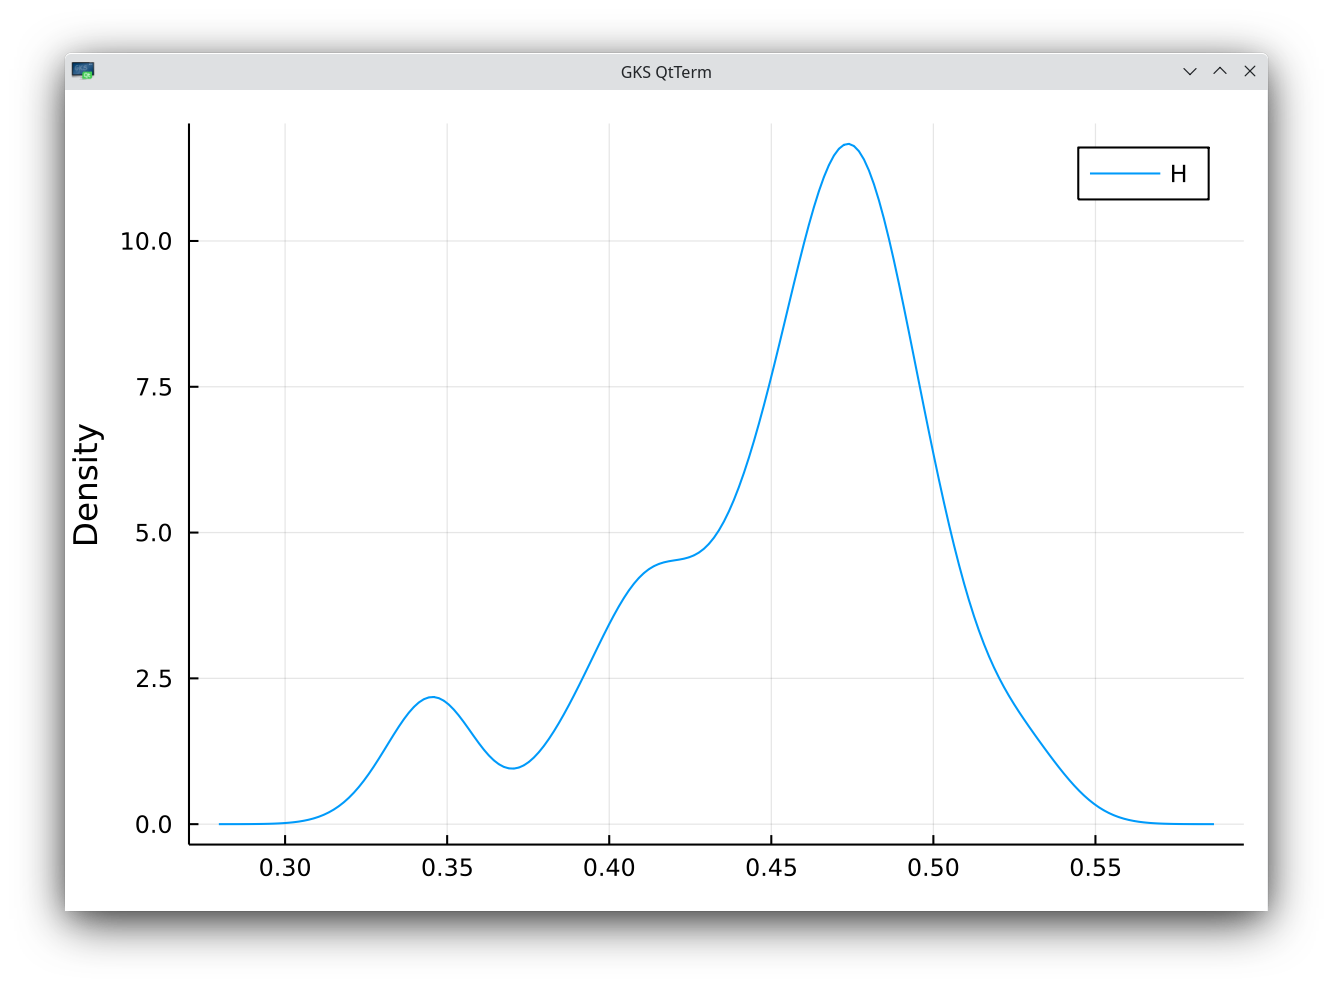
Roughness is apparent in the 10-day implied volatility, with H=0.35. For the 60-day implied vol, I measure a roughness H=0.41 with a deviation of 0.06, so again not significantly different from the standard Brownian motion roughness. The roughness of the implied volatility skew, also available in this data, is more pronounced.
Another interesting analysis is the roughness of the VIX index, which can be mapped to the price of a newly issued 30 days variance swap on the SPX index. I am actually slightly surprised that the various papers on rough volatility have not looked at it already. I just took the quotes from Yahoo. With K=51, I find H=0.347 with a standard deviation of 0.026. This is close to the 10-day implied volatility roughness measured previously.
VIX roughness index sliding estimate with K=51.
density of VIX roughness index estimate with K=51. The mean is 0.347 with a standard deviation of 0.026
What about the Heston model? What is the estimate of the roughness index on a simulated stochastic variance path? Using one time-step per day for 5 years, and K=25, we find H=0.505 with a standard deviation of 0.032 for the roughness of the instantaneous variance, as well as for the one of the one-month at-the-money implied volatility (using v(t) and constant Heston parameters). This is, as expected, the standard roughness of the underlying Brownian motion.
To conclude, the Hurst index H of the implied volatility, and of the VIX index appear to be not as low as the one of the 5 minutes historical volatility. The estimated roughness H=0.35 is much closer to the standard Brownian motion roughness. In fact, for the 30-day implied volatility (with daily quotes), the measure is even closer to 0.5.
Looking at the 5 minutes historical volatility may make sense to price intraday options, but it is not clear what is the importance of it for traditional derivatives pricing (with maturities longer than a week). Does the historical micro-structure really matter there?
After writing all that, I found out Livieri et al. (2017) paper titled Rough volatility: evidence from option prices which also measures the roughness of the implied volatilities. Interestingly, I did not reproduce some of the claims in that paper: I find a large bias in the implied volatility proxy even for a low H value. The large bias, combined to the uncertainty in the measurement makes the implied volatility proxy not very practical to estimate the true Hurst index of the underlying volatility process. Another discrepancy with the paper is around the Heston model: I do not find any apparent roughness at all in the Heston model.
I added this post, with more details, as a note on arxiv, just in case someone needs to reference this. I intend to place some the Julia code I wrote in the context of the paper on github, although I did not find the time yet.