Dupire Local Volatility with Cash Dividends
The Dupire equation for local volatility has been derived under the assumption of Martingality, that means no dividends or interest rates. The extension to continuous dividend yield is described in many papers or books:
$$\sigma^{\star 2}\left(K, T\right) = \frac{\frac{\partial C}{\partial T}+(r_B-q)K \frac{\partial C}{\partial K} + q C(K,T)}{\frac{1}{2}K^2\frac{\partial^2 C}{\partial K^2}}$$
In this case, \(C\) is a regular market Call option price, that can also be obtained from market volatilities via the Black-Scholes formula.
With cash dividends however, the Black-Scholes formula is not valid anymore if we suppose that the asset jumps at the dividend date of the dividend amount. There are various relatively accurate approximations available to price an option supposing a constant (spot) volatility and jumps, for example, this one.
Labordère, in his paper Calibration of local stochastic volatility models to market smiles, describes a mapping to obtain the market local volatility corresponding to the model with jumps, from the local volatility of a pure Martingale. Assuming no interest rates and no proportional dividend, the equations looks particularly simple, it can be simplified to:
$$\sigma^{\star 2}\left(K, T\right) = \frac{\frac{\partial \hat{C}}{\partial T}}{\frac{1}{2}K^2\frac{\partial^2 \hat{C}}{\partial K^2}}$$
where \( \hat{C} \) is the market Call option price, that can be obtained via an approximation of the spot model with dividend jumps, of strike K and maturity T. Yes, if you look carefully at the Labordere formulae, most of it simplifies.
While it appears very simple, in practice, it is not so much. For example, let’s consider a single maturity smile (a smile, constant in time) as the market reference spot vols. Which volatility should be used in the formula for \( \hat{C} \)? logically, it should be the volatility corresponding to the market option price of strike K and maturity T. The numerical derivatives will therefore make use of 4 distinct volatilities for K, K+dK, K-dK and T+dT. In the pricing formula, we can wonder if at T+dT, the price should include the eventual additional dividend or not (as it is infinitesimal, probably not).
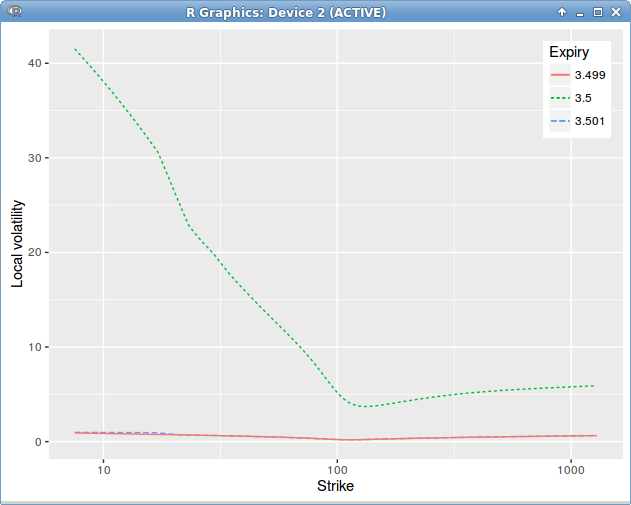
It turns out that applying the above formula leads to jumps in time in the local volatility, around the dividend date, even though our initial market vols were flat in time.
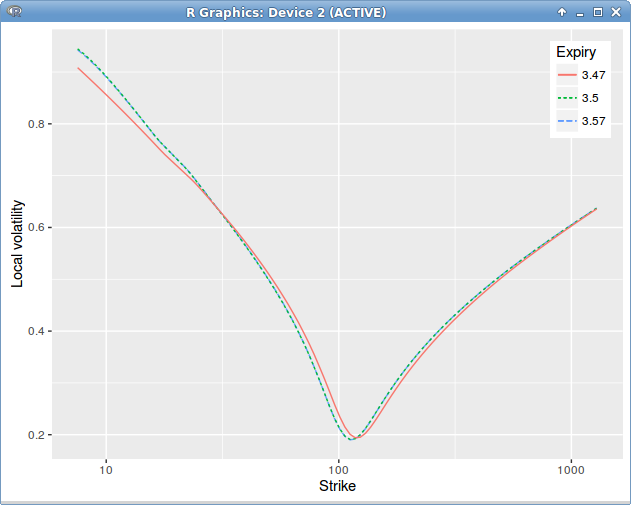
Dupire Local Volatility under the spot model with jump at dividend date = 3.5 on a single constant in time spot smile.
The mistake is not that clear. It turns out that, when using a single volatility slice, extrapolated in constant manner, the option continuity relationship around the dividend maturity is not respected. We must have
$$C(S_0,K,t_{\alpha_i}^-) = C(S_0, K-\alpha_i,t_{\alpha_i}^+)$$
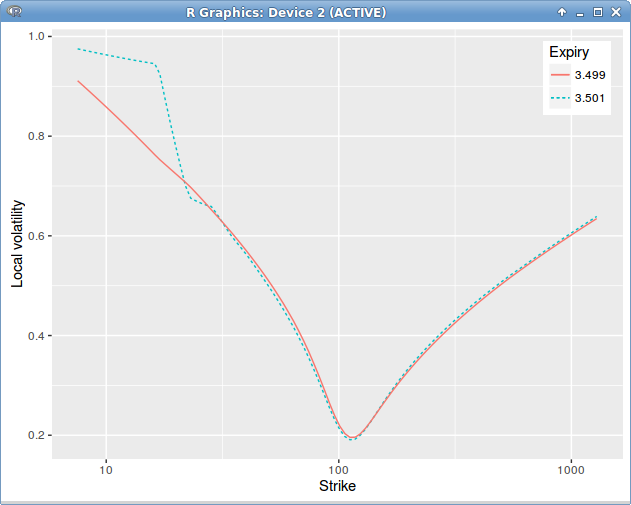
As the spot model with constant vol obeys this relationship, this implies that the slice immediately before the dividend must be a shifted representation of the slice immediately after in order for this relationship to stay true with a smile. If we add this slice, the error in repricing under local volatility with jumps becomes much smaller, although it is still quite larger than the regular local volatility, even with a somewhat discontinuous yield.
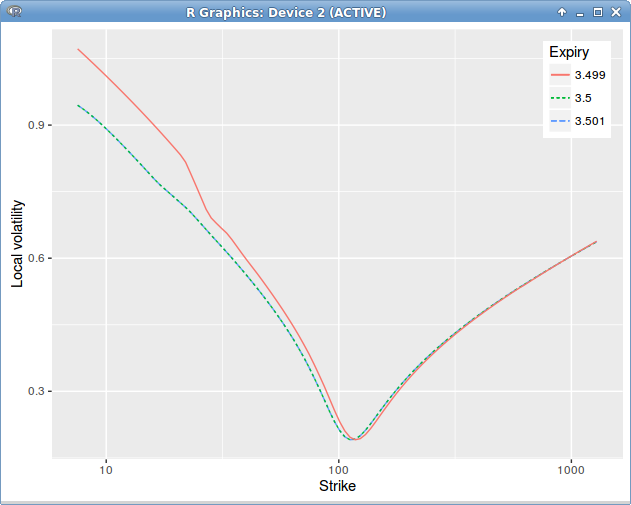
Dupire Local Volatility under the spot model with jump at dividend date = 3.5, introducing a slice before the dividend date to enforce the price continuity relationship.
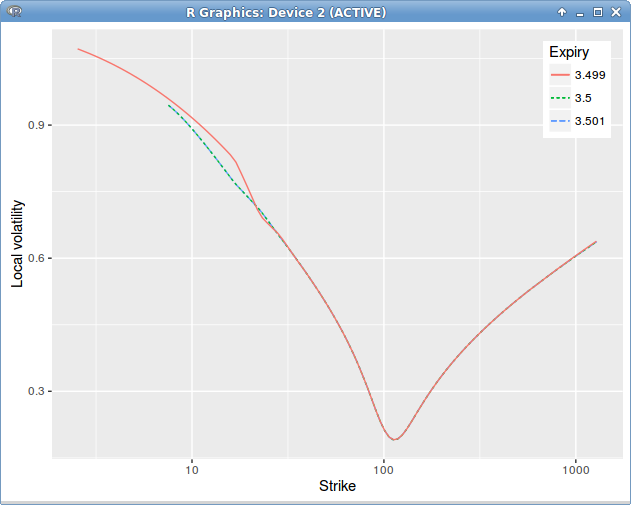
Look, when we shift by the dividend!
The slightly funny shape of the local volatility in the left wing, before the dividend, is due to linear extrapolation use.
Interestingly, there is quite a difference in the local volatility for low strikes, depending on the dividend policy, here is how it looks for a single dividend with liquidator vs survivor policy.
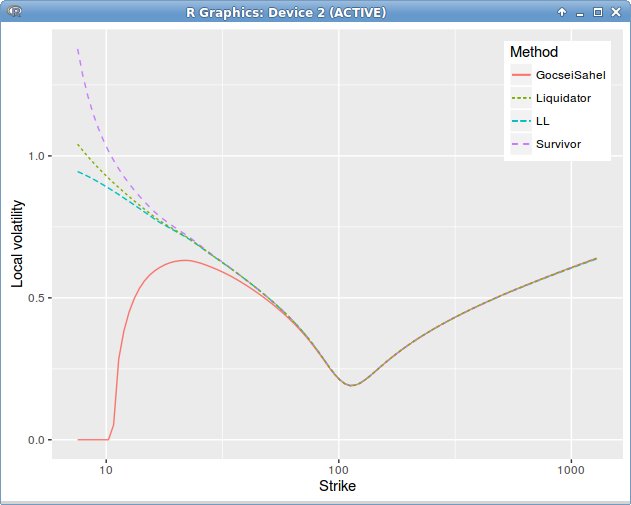
Dupire Local Volatility under the spot model with jump at dividend date = 3.5 on a single constant in time spot smile.
The analytical approximations lead to another different local volatility from both policies, but don’t differ much from each other. Guyon and Labordere approximation based on the skew averaging technique of Piterbarg, not displayed here, is the worst. Gocsei-Sahel approximation has some issues for the lower strikes, the Etore-Gobet expansions on strike or on Lehman and the Zhang approximation are very stable and accurate, except for the very low strikes, where the dividend policy starts playing a more important role. Those differences however don’t impact the prices very much as the prices with the various methods (excepting the Guyon-Labordère approximation) are very close, and differ of a magnitude much smaller than the error to the true price.
The continuous yield approach consist in first building the equivalent Black volatility and use the regular Dupire on it. This is qualitatively different from a cash dividend jump, and is closer to a proportional dividend jump. Note that there is still a jump in the continuous yield local volatility:
Dupire Local Volatility under the forward model.
Dupire Local Volatility under the forward model.
Overall, when the dividends happens early, the Dupire formula for cash dividends works well, but when the dividends are closer to maturity there is a marked bias in the prices, that does not disappear with more steps in the FDM. Typically, at \(0.7T\), the absolute price error is around 0.01 and more or less constant accross strikes. In contrast, the classic continuous yield Dupire behaves well, despite the spike, and the error decreases with the number of steps, I obtain around 5E-4 with 500 steps.
I would have expected a much better accuracy from Labordère’s approach, it’s still not entirely clear to me if there is not an error lurking somewhere. This is how an apparently simple formula can become a nightmare to use in practice.
Update: A follow-up to this post where I resolve the mysterious remaining error.