Arbitrage Free Interpolation of Option Prices using Piecewise Constant Density
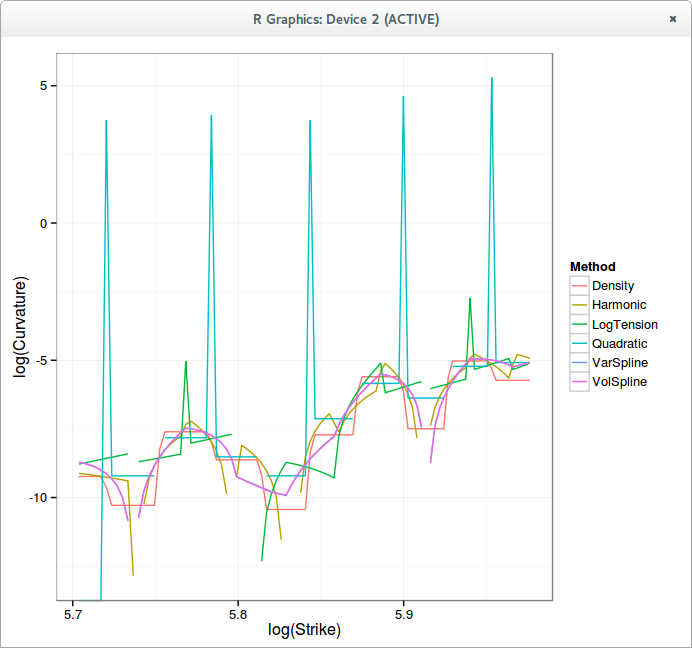
Tension splines can produce in some cases arbitrage free C2 interpolation of options, but unfortunately this is not guaranteed. It turns out that, on some not so nice looking data, where the discrete probability density is not monotone but only positive, all previously considered interpolation fail (spline in volatility or variance, tension spline in log prices, harmonic spline on prices).
| K | vol | put | b-slope | b-convexity |
|---|---|---|---|---|
| 300.0 | 0.682 | 0.090 | 0.00e+00 | 0.00e+00 |
| 310.0 | 0.654 | 0.136 | 4.60e-03 | 0.00e+00 |
| 320.0 | 0.621 | 0.192 | 5.60e-03 | 1.00e-03 |
| 330.0 | 0.594 | 0.288 | 9.60e-03 | 4.00e-03 |
| 340.0 | 0.560 | 0.404 | 1.16e-02 | 2.00e-03 |
| 350.0 | 0.520 | 0.530 | 1.26e-02 | 1.00e-03 |
| 360.0 | 0.484 | 0.736 | 2.06e-02 | 8.00e-03 |
| 370.0 | 0.467 | 1.232 | 4.96e-02 | 2.90e-02 |
| 380.0 | 0.442 | 1.898 | 6.66e-02 | 1.70e-02 |
| 390.0 | 0.427 | 3.104 | 1.21e-01 | 5.40e-02 |
| 400.0 | 0.412 | 4.930 | 1.83e-01 | 6.20e-02 |

Possibly the simplest arbitrage free interpolation is to postulate the density as piecewise constant, ideally centered around each strike (if not centered, there is no guarantee that it will be positive). If a spline is used for interpolation, this means a quadratic spline. Unfortunately, because it is not C2, it then still fails to be arbitrage free.
It is also possible to price by integrating the payoff over the density. There is then one degree of freedom, the Fmin (minimum forward allowed before absorption) that can be adjusted so as to make the density always positive. This produces our only arbitrage free interpolation of the above input put option prices.

The implied volatility looks reasonable on this strange input: very much like a spline on volatilities. In contrast, the parabolic interpolator produces an oddly looking implied volatility shape, even though the density is in a way similar: piecewise constant. This is likely because I forced the second derivatives to match the discrete curvature, it is then not C1 in prices.
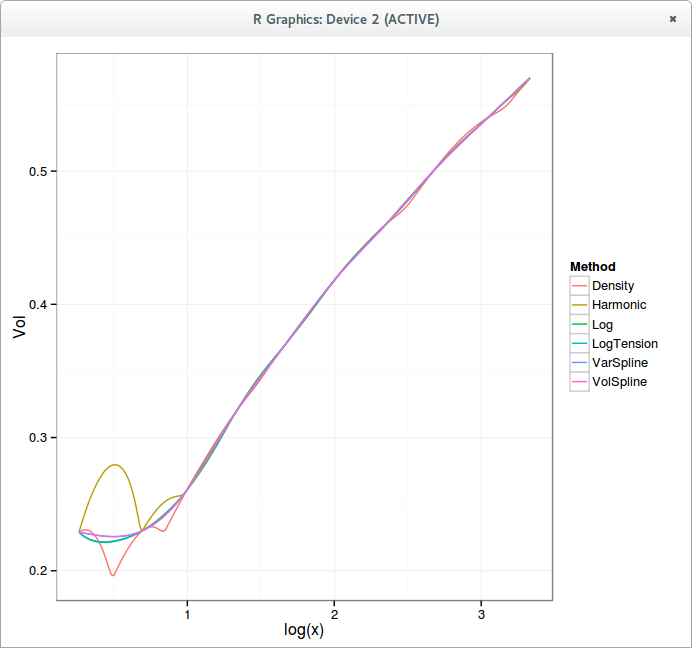
Unfortunately, the piecewise constant density interpolant can also produce some strange implied volatility shapes, for example on P. Jaeckel example data:

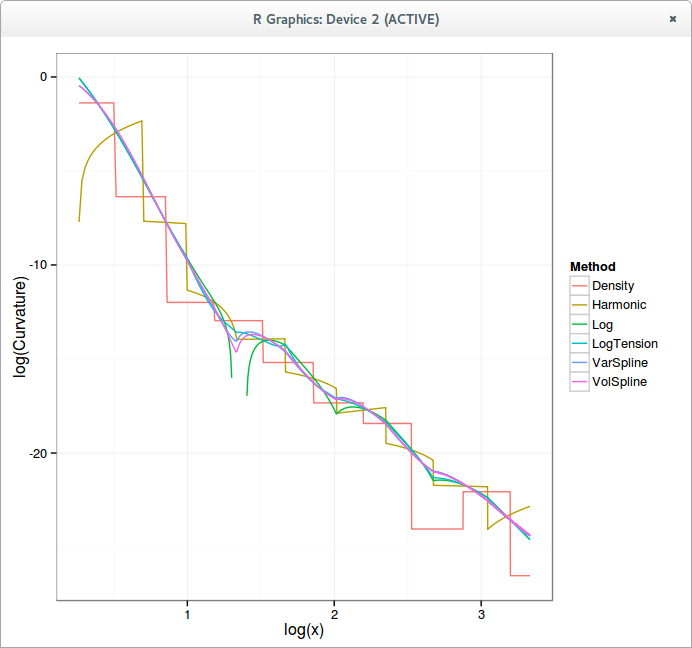
We find back the wiggles for large strikes. The lower end is particularly funny (which could be due to the fact that I don’t have the data for low strikes). This is the corresponding density:

It appears then not so easy to produce a simple generally good looking interpolation.