Where is the S&P 500 going to end?
Yesterday the American stocks went a bit crazy along with the VIX that jumped from 17.50 to 38. It’s not exactly clear why, the news mention that the Fed might raise its interest rates, the bonds yield have been recently increasing substantially, and the market self-correcting after stocks grew steadily for months in a low VIX environment.
I don’t exactly follow the SPX/SPW options daily. But I had taken a snapshot two weeks ago when the market was quiet. We can imply the probability density from the market option prices. It’s not an exact science. Here I do this with a least-squares spline on the implied volatilities (the least squares smoothes out the noise). I will show another approach in a subsequent post.
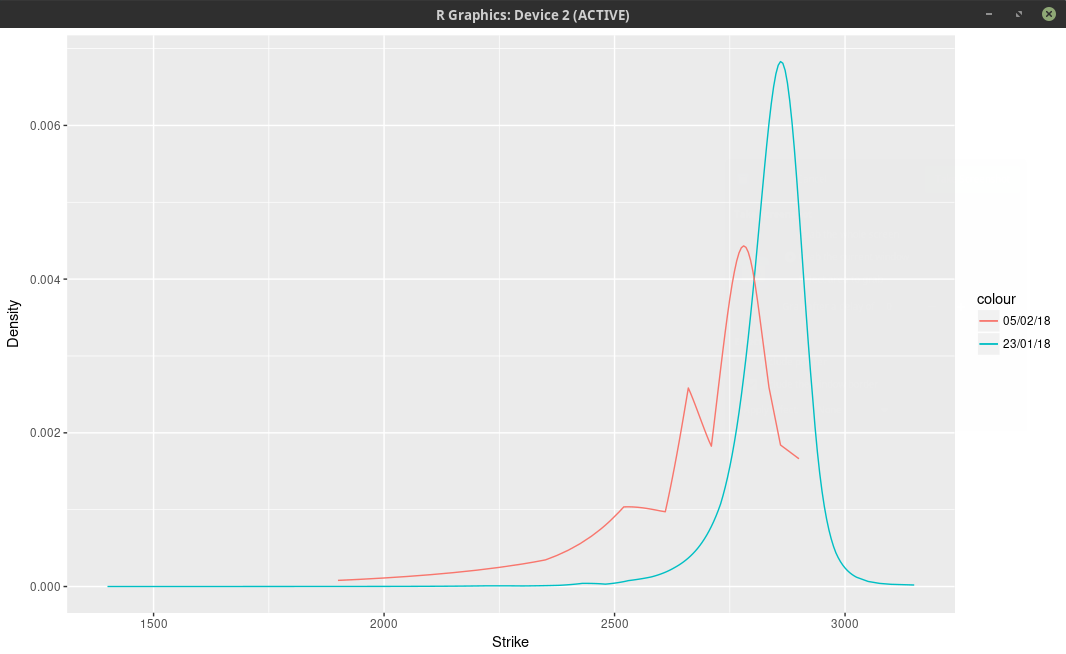
probability density of the SPX implied from 1-month SPW options.
We can clearly see two bumps and a smaller third one further away in the left tail. This means that the market participants expect the SPX500 to go mostly to 2780 (slightly below where the spx future used to be) one month from now. Some market participants are more cautious and believe it could hover around 2660. Finally a few pessimists think more of 2530.
Option traders like to look at the implied volatilities (below).
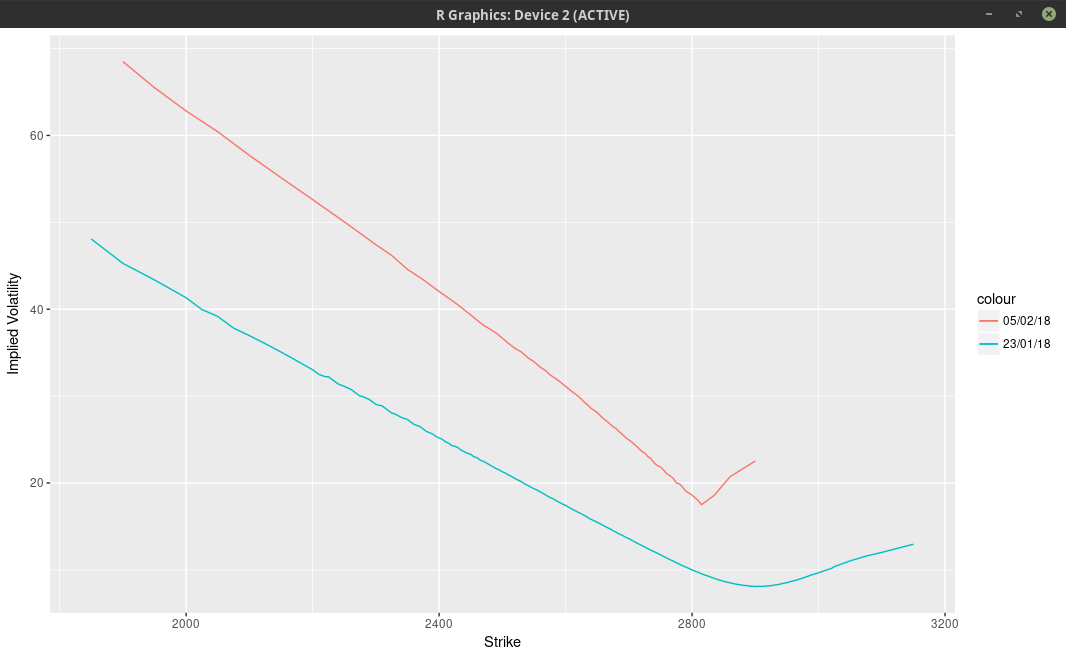
implied volatilities of 1-month SPW options.
On the graph above, it’s really not clear that there is some sort of trimodal distribution. There is however an extremely sharp edge, that we normally see only for much shorter maturities. The vols are interpolated with a cubic spline above, not with a least-squares spline, in order to show the edge more clearly.
This is a bit reminiscent of the Brexit bets where Iain Clark shows two modes in the probability density of the GBP/USD.